Description
Onmon - Audio & Voice Spectrogram for iPad
![]()
"Onmon" is Spectrogram Analyzer app for Audio and Voice band. It uses the Fast Fourier Transform (FFT) processing to analyze incoming sound signals and provides a precision frequency response measurement.
"Onmon" is a visual representation of the spectrogram of frequencies in a sound as they vary with time in the frequency range of 24kHz from 20Hz. In addition, this app is equipped with the replay function, so you can see the spectral analysis results offline.
This app has two analysis modes, Audio mode and Voice mode. Audio mode performs a real-time spectral analysis as the target of audio signal by Spectrogram and Spectrum. It can be used for discovering visual hidden images in the various sounds, such as music, birdsongs and environmental sounds. You can also be used to capture an unpleasant high-frequency noise in your sound system.
Voice mode performs the frequency domain analysis as the target of voice signal, which can be displayed simultaneously Spectrum, Cepstrum, Envelope, Formant and Spectrogram. It can be used for visualization analysis of voices, speech, vocal, and squeaking sound of the animal.
Products Information
- Version: 5.0
- Release date: July 31, 2018
- Size: 0.5 MB
- Category: Education, Music
- Compatibility: Compatible with iPad. Requires iOS 11.4 or later. Not compatible with iPadOS 14 or later.
* This app is not recommended to run on iPadOS 14 or later. Please be careful when updating the OS.
- Status: Unsubscribe
Spectrogram
The spectrogram is a graphical image with two geometric dimensions that the horizontal axis represents time and the vertical axis is frequency, and the addtional third dimension is indicating the amplitude of a particular frequency at a particular time that is represented by colour of each point in the image.
"Onmon" measures the input acoustic signals, and displays the frequency spectrogram of 24kHz, 12kHz, 6kHz, 3kHz and 122 split bands of 1/12 octave.
- Observation frequency range: 20 - 24000Hz
- Measurement display X-axis - time(sec)
- Measurement display Y-axis - frequency(Hz)
- Measurement display color image - signal's amplitude
Features
"Onmon" has the following features:
[common]
- FFT: 4096 points/frame.
- Sampling Rate: 48kHz/sample (maximum measurements frequency: 24kHz).
- Spectrogram analysis (horizontal-axis:time, vertical-axis:frequency, color-image:amplitude)
- Spectrum analysis
- Display capture facility (Snapshot: Storage image file in PNG format).
[Audio mode]
- Spectrogram display
- Spectrum response display
- Frequency bandwidth : 24kHz, 12kHz, 6kHz, 3kHz, 1/12 octave band
- Time resolution selection (L/H) : When high time resolution "H", the frequency bandwidth becomes 1/2. (12kHz, 6kHz, 3kHz, 1kHz)
- Dynamic range of Amplitude display: 120dB
- Pan to adjust visible amplitude ranges. (Range: 0dB/-30dB)
- Peak-Level Hold function. (Hold)
- Replay function with offline analysis.(Set/Play)
- Measurement time : Up to 180 seconds
[Voice mode]
- FFT Spectrum display
- Cepstrum display
- Envelope display
- Formant display : 1st, 2nd frequency
- Spectrogram display
- Replay function with offline analysis. (Set/Play)
- Measurement time : Up to about 45 seconds
Applications
"Onmon" can be very useful for a variety of applications including:
- Transient characterization of playback frequency of speakers and headphones
- Testing and Characterization of audio equipment, setting
- Visualization analysis of the sound source, such as voice, conversation and animal sounds
- Analysis and evaluation of environmental sounds, noise pollutions, mechanical noises of the factory, vibration sounds of the car, and more....
- Analysis of the sound configuration, such as music performance
- Various acoustic testing, and others
Mode
"Onmon" has two operation modes, Audio and Voice mode. It can be switched between Audio mode and Voice mode. Mode switch is located on each mode, the operation mode transitions by tapping the button. The system will start Audio mode in the app startup.
Audio mode - Top view
The top view of Audio mode includes the operation control buttons and the measurement display (TRACE DISPLAY).
It has thirteen buttons for the operation control. In order from the top, there are the measurement control (Start/Stop), frequency selections (1kHz - 24KHz, 1/12 octave band), replay control(Set/Play), hold function (hold), signal power range (range: 0/ -30dB), Snapshot, INFO and mode switch (Voice).
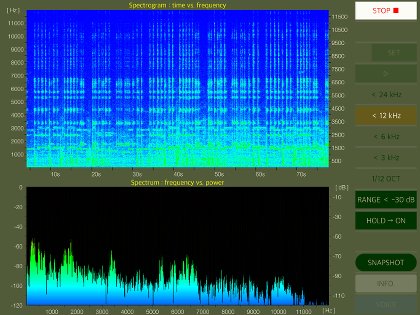
Audio mode - Trace Display
"TRACE DISPLAY" is the image monitor that displays the frequency spectrogram and spectum measurements.
It will display the color spectrogram of frequency for each specific time. The horizontal axis (X-axis) is time, the vertical axis (Y-axis) is frequency (frequency is higher on top of the graph.). The signal strength of each frequency will be drawn full color graphics. (As it becomes close to redden, the signal strength is strong.)
Audio mode - Start/Stop
By tapping "Strat" button, the spectrum analysis will start and display the results on "TRACE DISPLAY". By tapping "Stop", it will be stopped. Measurements of this mode will automatically stop at a maximum of 3 minutes.
In addition, the microphone input signal is temporarily stored as digital data. You can re-display the analysis result in Replay function.
The access permission to the microphone will be confirmed from the iOS system at the first start-up. Please enable access to the microphone.
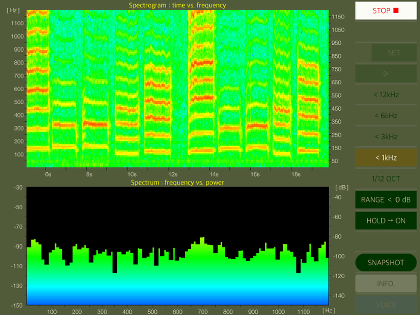
Audio mode - Frequency
According to the sound characteristics and the observation bandwith frequency, you will be able to select the target frequency. You can choose one of the frequency from five frequency selection button (24Khz, 12kHz, 6kHz, 3kHz, 1/12 octave band). For example, if you select the 6kHz frequency, the spectral measurement will be displayed the frequency range up to 6kHz. In the case of 1/12 octave, it will be displayed at 122 divided frequency bands of 1/12 octave.
Audio mode - Time resolution
This function is used to observe changes in the time axis in more detail. In Version 5.0, the time resolution selection function (L/H) has been added. When the time resolution settings is set to "H", the time resolution becomes higher, and conversely the displayable frequency range is halved. You can change the time resolution setting in the INFO view. The default is "L", which is same as the time resolution up to the previous version.
Audio mode - Hold
"Hold" is a setting of the peak hold function of the trace display. It is the function to continue to retain the maximum value of each frequency band. If you enable "Hold" (HOLD ON), it is possible to observe a maximum cumulative value of the spectrum of the acoustic signal over a long period of time. The default is to disabled (HOLD OFF).
Audio mode - Range
"Range" is the setting of the display power range. Dynamic range of the signal intensity in "TRACE DISPLAY" is 120dB. By "Range" setting, you can be observed in the amplitude display range that is shifted at "0dB" or "-30dB". The default is set to "0dB".
Audio mode - Set/Play
It is replay function that can display the temporarily stored measurement data. Load the recorded data with "Set" button and display the measurement result with "Play" button. When it is displayed up to the end point of the recorded data, it is necessary to set the recording data again. You can also evaluate again by changing parameters of frequency, time resolution, signal range.
Audio mode - INFO
It is displayed the product information, support link and time resolution settings (L/H). If you tap "Support", it will jump to the support page Safari is launched.
Voice mode - Top view
The view of Voice mode includes the operation control buttons, TRACE DISPLAY. Operation controls has six buttons, in order from the bottom left, the measurement control (Start/Stop), replay control (Set/Play), Snapshot, INFO and mode switch (Audio).
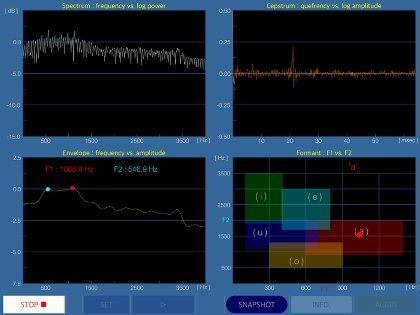
Voice mode - Trace Display
This mode performs the frequency domain voice analysis for the microphone input signal.
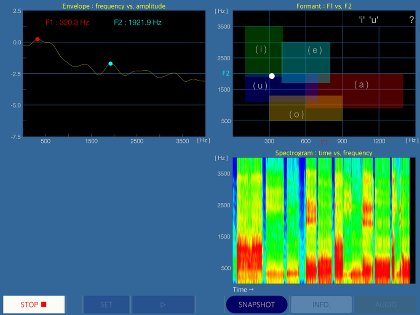
To view Spectrogram chart, please swipe down "TRACE DISPLAY".


[Display of Voice analysis]
- FFT Spectrum : Display FFT-spectrum of input signal.
- Cepstrum : Display Cepstrum.
- Envelope : Display envelope of spectrum.
- Formant : Display Formant matrix of F1 and F2.
- Spectrogram : Display spectrogram of Envelope.
Voice mode - Start/Stop
By tapping Strat button, the voice analysis will start and display the results on "TRACE DISPLAY". By tapping "Stop", it will be stopped. Measurements of this mode will automatically stop at a maximum of about 45 seconds.
Voice mode - Set/Play
It is replay function that can display the temporarily stored measurement data. Load the recorded data with "Set" button and display the measurement result with "Play" button. When it is displayed up to the end point of the recorded data, it is necessary to set the recording data again.
Snapshot
"Snapshot" is a function of capturing a still image for the trace image being currently measured.
At the tap of "Snapshot" button, the image of "TRACE DISPLAY" is saved PNG file format to Photos. File name is IMG_xxxx.png.
In addition, at the first time, the confirmation of access to Photos is required once from iOS system when you press "Snapshot" button.
Information view
It is displayed the product information and support link. If you tap "Support", it will jump to the support page Safari is launched.
Release Note
- "Onmon" version 5.0+ was released on April 15, 2021 UTC.
* Updated to use the latest Apple signing certificate by Apple.
* Requires iOS 11.4 or later. Not compatible with iPadOS 14 or later.
- "Onmon" version 5.0 was released on July 31, 2018.
- "Onmon" version 4.1 was released on July 29, 2016.
- "Onmon" version 4.0 was released on July 16, 2016.
* This app has been renamed to "Onmon" from "fo-Onman".
- "fo-Onmon" version 3.0 was released on April 25, 2015.
- "fo-Onmon" version 2.0 was released on August 22, 2014.
- "fo-Onmon" version 1.0 was released on December 19, 2013.
Note
- This app is not guaranteed to run on iPadOS 14 or later. Please be careful when updating the OS. In addition, please update to our latest code of version 5.0+ to use it.
- At the time of the first access to microphone and photos after installing the app, you will be asked permission to access them from the OS. If you did not enable this setting on this time, it can not be access from the app by privacy restrictions of the OS. Please enable slide switch of the app in the access permission of the iOS setting, "Settings > Privacy > Photos or Microphone".
- In Voice mode, when you tap or scroll to the screen during measurement analysis, the measurement display temporarily stops. At this time, spectrogram display may be affected, but it is possible to display the measurement result correctly by re-displaying with replay. It is recommended to start measurement after setting to the display screen you want to display in advance.