Description
Sound Lissajous Meter
![]()
"Sound Lissajous Meter" is a new sound analysis app that displays audio signals in Lissajous curves.
Lissajous is a planar figure obtained by combining two single vibrations vibrating in directions perpendicular to each other.
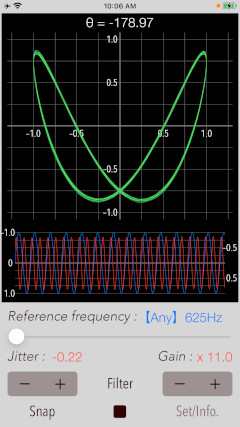
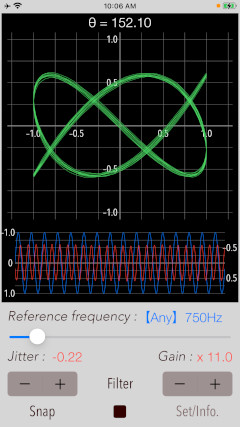
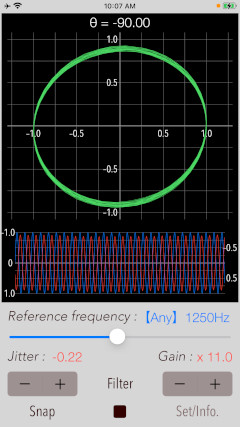
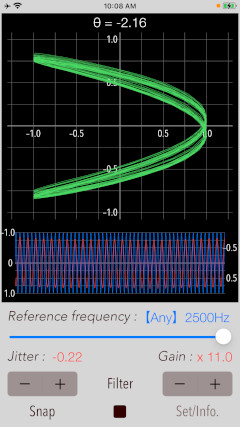
This app can be displayed in a two-dimensional curve by Lissajous in the vertical axis as a microphone input signal and the horizontal axis as a reference sine wave.
For example, when a sine wave with the same frequency as the reference sine wave is reproduced from an audio system, you can observe changes of the frequency or phase in a Lissajous curve pattern.
In the case of an unknown sound source, you can analyze the source using the correlation between amplitude, frequency and phase and the reference sine wave.
In addition, It can display Lissajous demo according to changes in frequency and phase. Please use for Lissajous pattern understanding and learning.
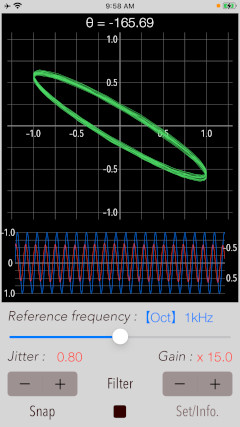
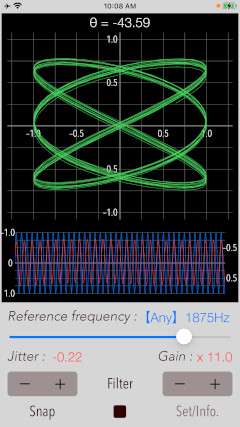
Products Information
- Version: 3.0
- Release date: February 27, 2023. UTC
- Size: 0.5 MB
- Category: Utilities, Education
- Compatibility: Compatible with iPhone. Requires iOS 15.0 or later.
- Status: Unsubscribe
Features
- Lissajous sound visualizations (X: internal reference signal, Y: microphone input signal)
- Mode selection of reference frequency (oct / scale / any) : "Oct" - 1/3 octave band (63Hz - 16kHz), "Scale" - 12 equal temperament (A3 - A5), "Any" - Arbitrary frequency input (100Hz - 10kHz)
- Reference frequency setting slider - change reference sine wave frequency. In "Any" mode, logarithmic change in reference frequency for 1/2 to 2.
- Input level adjustment (gain) : 0 - 40 (0.1 step)
- Jitter adjustment (Jitter): ± 2.0 (0.01 step)
- Noise filter (Filter)
- Demo display (Lissajous): Lissajous sample display
- Optimized for iPhone, Compact code size.
Applications
- Checking phase of room acoustics or monitoring changes in amplitude, phase and frequency from place to place.
- Analysis of unknown sound signal.
- Monitoring and analysis of environmental sounds.
- Sound Visualizer
Important initial settings
In order for this app to work properly, it is necessary to make the following initial settings related to the iOS system.
- Microphone access permission setting
- Photos access permission setting
- Sound Lissajous Meter 3.0 was released on February 27, 2023. UTC
- Sound Lissajous Meter 2.1 was released on February 26, 2021. UTC
- Sound Lissajous Meter 2.0 was released on November 26, 2020. UTC
- Sound Lissajous Meter 1.0 was released on March 20, 2019. UTC
- The internal reference signal and the measured signal are asynchronous. Since the signals from the microphone and other external inputs are not synchronized, the synchronization relationship is not guaranteed by stop/start, change of various parameters, etc.
- The phase θ is valid only when the reference frequency and the measurement frequency are the same.
- At the time of the first access to Microphone and Photos after installing the app, you will be asked authorization to access them by the iOS system. If you have not enabled this setting, the app can not access them by privacy restrictions of the iOS system. Please enable the access permission on the iOS setting, "Settings > Privacy & Security > Photos or Microphone".
At the initial startup after installing the app, the iOS system asks for permission to access the built-in microphone. In this case, you need to enable access to "Microphone".
If you have not enabled this setting, this app can not work by privacy restrictions of the iOS system. Please enable the access permission on the iOS setting, "Settings > Privacy & Security > Microphone".
When the first time you save an image data with Snapshot, the iOS system asks for permission to access the "Photos" library. In this case, you need to enable access to "Photos".
If you have not enabled this setting, this app can not work by privacy restrictions of the iOS system. Please enable the access permission on the iOS setting, "Settings > Privacy & Security > Photos".
Operation procedure
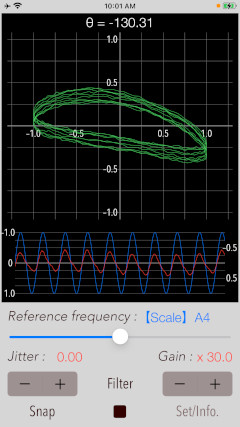
"Sound Lissajous Meter" displays audio signals in Lissajous curves in real-time.
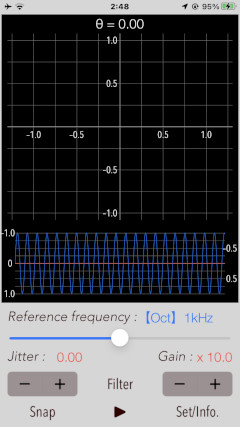
The basic operation procedure is as follows:
(1) Adjustment of input signal gain : By adjusting the gain of the input signal, you can resize the Lissajous curve of the measurement display to an appropriate size.
(2) Selection of reference frequency: Select one mode from 1/3 octave band (Oct), 12-tone equal temperament (Scale), or arbitrary frequency input (Any), and set it with the frequency adjustment slider.
(3) Filter: Turn on the noise filter if the input signal contains a lot of noise and the measurement display is unstable. The default is filter off.
(4) Jitter correction: Jitter correction is performed when the phase of the measurement display is unstable, such as rotation. The frequency of the reference signal can be adjusted in the range of ± 2 Hz.
(5) Snapshot: Save the measured image to "Photos" library.
Lissajous measurement
It can be displayed in a two-dimensional curve by Lissajous in the vertical axis as a microphone input signal and the horizontal axis as a reference sine wave.
you can analyze the source using the correlation between amplitude, frequency and phase and the reference sine wave.
In addition, the waveform display of the input and reference signals and the phase θ between both signals are also displayed simultaneously. The phase θ is valid only when the reference frequency and the measurement frequency are the same.

Input gain
Adjust the Lissajous curve of the measurement display to the appropriate size by adjusting the gain of the input signal.
Enabling the noise filter may reduce the level of the input signal extremely. Adjust the input level to make it easy to see the amplitude of Lissajous.
Reference frequency
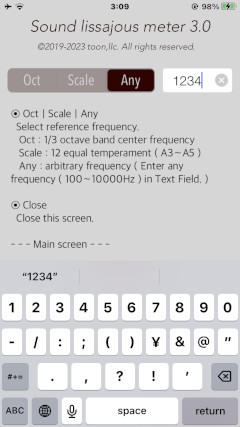
Frequency settings in 1/3-octave band (Oct) or 12-tone equal temperament (Scale), or even arbitrary frequency input (Any) are possible.
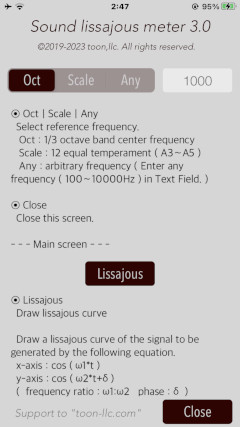
Tap "Set/Info" button to select the frequency setting mode (Oct / Scale / Any). In the case of Any mode, you can tap the frequency window to enter a number directly.
Filter
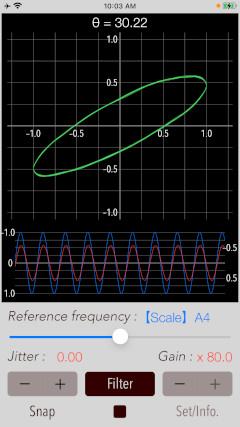
If the input signal contains a lot of noise and the measurement display is unstable, you may enable the noise filter. The default is filter OFF. The filter takes out the exact maximum frequency of the frequency components contained in the input signal.
Jitter
It can slightly adjust the jitter between the reference frequency and the input signal. The range is ± 2 Hz per 0.01 Hz unit. The default is 0 Hz.
The jitter adjustment can reduce the rotation of the phase angle when Lissajous curve's phase changes sequentially at the same observation position. But, the correction may not be possible if the phase change is severe.
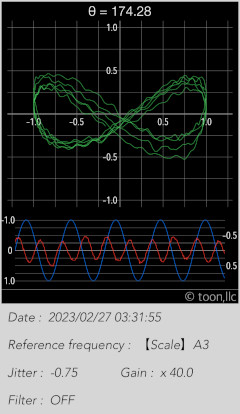
Snap
If you tap "Snap" button, you can capture the measured image to Photos. At the first time, the confirmation of access to Photos is required once from iOS system when you press "Snap" button.
Lissajous demo
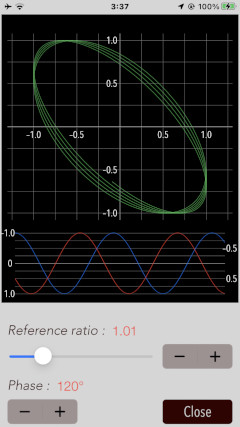
Tap "Set/Info" button to switch to the information screen. If you tap the "Lissajous" button, it move to Lissajous demo.
By changing both the frequency ratio and the phase, you can see Lissajous curve.
It will draw a Lissajous curve of the signal to be generated by the following equation.
# x-axis: cos(w1*t)
# y-axis: cos(w2*t+δ)
(frequency ratio: w1:w2 = 0.25 to 4.0) (phase: δ = ±180 degree)
Information view
By tapping "Set/Info" button, it is displayed the product description, reference frequency mode settings and Lissajous demo. By tapping "close" button, it will move to the top view.
Release note
Note
Contact us
For inquiries and consultation regarding our iOS app products, please contact the following support desk.
About Inquiries
 toon,llc.
 Return to Top