Description
Magnetscape - Magnetic measurement & analysis tool
![]()
"Magnetscape" is a new real-time measurement app that observes invisible magnetic fields using the iPhone's built-in magnetic sensor.
There are various magnetic fields around us. For instance, the magnetic field fluctuates even when large motors, compressors or metal are nearby. The Earth's magnetic field exists even in empty places, and we are constantly affected by it.
"Magnetscape" enables real-time monitoring of surrounding magnetic fields and can be utilized for various applications in real life. It can be used for investigating static magnetic fields, searching weak electromagnetic fields within alternating magnetic fields, locating metals and more.
This app features three measurement modes for magnetic field observation, allowing you to use it according to your needs.
The latest version is compatible with iOS 26.1, optimized internal processing and improved stability.

Please click on the link below to access "Magnetscape" product page in AppStoreTM.
- Communications charges when connecting to AppStore will be borne by the customer.
- iPhone is a trademark of Apple Inc., registered in the U.S. and other countries. AppStore is a service mark of Apple Inc.
Products Information
- Version: 8.0
- Release date: December 1, 2025. UTC
- Size: 0.7 MB
- Category: Utilities, Education
- Compatibility: Compatible with iPhone. Requires iOS 18.7 or later. iPad products are not recommended.
- Status: Now distributing.
Features
- Graphical display of magnetic field observation by magnetic sensor (Scope)
- Time displacement graph display of magnetic field observation (Time)
- FFT analysis (FFT)
- Magnetic field observation
- X axis: intensity (Bx) of the magnetic field of (the right direction toward the screen)
- Y axis: intensity (By) of the magnetic field of (upward toward the screen)
- Z axis: magnetic field strength (Bz) in the of (vertical upward direction of the screen)
- Composite magnetic flux density: The magnetic field strength (Bcomp) that takes all three components of the x axis, the y axis, and the z axis into consideration
- Sampling frequency: 32 Hz
- Unit of observation value: uT
- Measurement time: 3 minutes
- Alert function: A warning message will be displayed if the composite magnetic flux density exceeds 300 μT.
- Alert sound generation function (Sound On/Off)
- Angle display function in Scope mode (Angle)
- Clock display function in Scope mode
- Peak hold function on FFT mode.
- Snapshot of measurement display (Snap)
Magnetic field and Electromagnetic wave
Magnetic field is the space in which the magnetic force works, there is strength and direction because of vector quantity. For example, permanent magnets have N poles and S poles, those with different polarities attract each other, and those with the same polarity repel each other's magnetic force in space.
In addition, the DC magnetic field is a magnetic field whose intensity is kept constant, such as geomagnetism, permanent magnets, etc. The AC magnetic field is a magnetic field in which the intensity of the magnetic field changes periodically, and it occurs in the vicinity of the transmission line, transformer and electric equipment. Such a magnetic field and an electric field are closely related, and it is also called an electromagnetic field in the low-frequency range, or an electromagnetic wave in the high-frequency range. Also, where high voltage or high frequency current flows, a strong magnetic field appears around it.
Magnetic field and electromagnetic waves are not directly visible to the eyes, so various phenomena and problems are overlooked. In particular, electromagnetic waves from electronic devices have various physical effects in some cases.
This app is a measurement tool for detecting such magnetic field. It is possible to measure and display the strength and direction of the magnetic field, the time variation of the magnetic field strength, FFT analysis of the triaxial synthetic magnetic field, etc.
Important initial settings (iOS permissions)
In order for this app to work properly, it is necessary to make the following initial settings related to the iOS system.
- Photos access permission setting
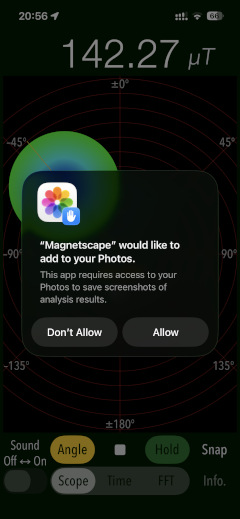
When the first time you save an image data with Snapshot, the iOS system asks for permission to access the "Photos" library. In this case, you need to enable access to "Photos".
If you have not enabled this setting, this app can not work by privacy restrictions of the iOS system. Please enable the access permission on the iOS setting, "Settings > Privacy & Security > Photos".
Operation procedure
This app collects 3-dimensional magnetic data from the iPhone's built-in magnetic sensor to measure and analyze the magnetic field of the environment.
1) Confirmation of usage method
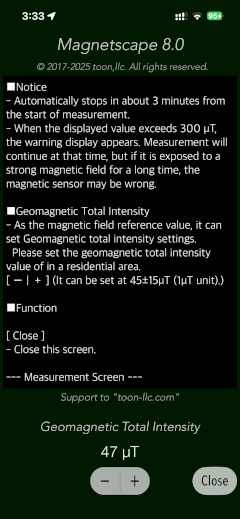
When the app is initially launched, the Info View is displayed. Please use this app after checking the instructions for use and the explanation of functions. Tap the Close button to return to the Top View measurement screen.
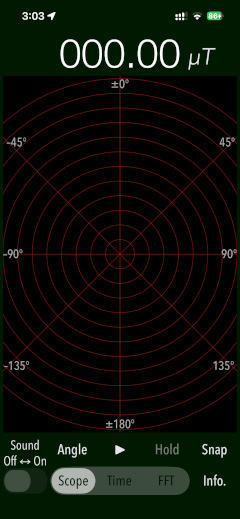
2) Measurement operation
This app has three different measurement modes. You can select either Scope, Time, or FFT. The default is Scope, and the measurement mode can be switched even during the measurement operation.
Tap the Start button to start magnetic field measurement in the respective mode, and tap the Stop button to stop.

3) Notes on measurement
Automatically stops after 3 minutes of measurement.
ALERT is displayed if the displayed value exceeds 300uT during magnetic field measurement. The measurement will continue even then, but if a strong magnetic field is applied for a long time, the magnetic sensor may be disturbed.
When Sound switch is set to "On", an alert sound is generated. The alert sound changes according to the strength level of the magnetic field. It is always "Off" at the It is always off at the start. Adjust the volume using the iPhone hardware volume.
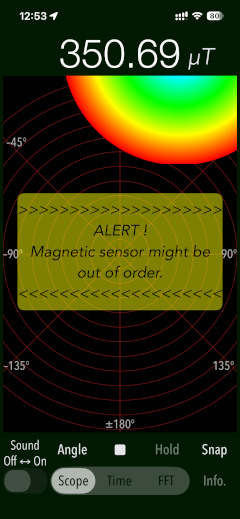
Magnetic field observation
Magnetic field observation of this application is performed according to the terminal posture with the following data and conditions.
- Magnetic field observation
- X axis: intensity (Bx) of the magnetic field of (the right direction toward the screen)
- Y axis: intensity (By) of the magnetic field of (upward toward the screen)
- Z axis: magnetic field strength (Bz) in the of (vertical upward direction of the screen)
- Composite magnetic flux density: The magnetic field strength (Bcomp) that takes all three components of the x axis, the y axis, and the z axis into consideration
- Sampling frequency: 32 Hz
- Unit of observation value: uT
Scope
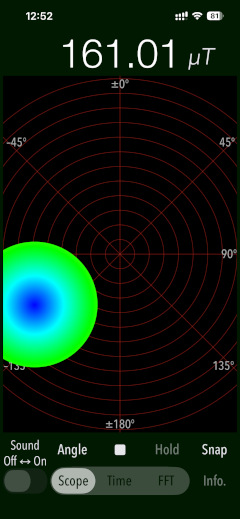
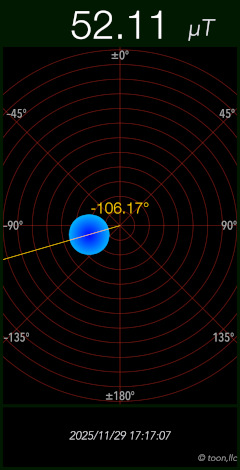
In Scope, the numerical value of the magnetic field strength (unit: uT) is displayed, and the "Level circle" is graphically displayed to show the strength and direction of the magnetic field. The display position of the "Level circle" moves according to the polarity of the magnetic source, but if the polarity is in the same direction as the geomagnetism, it will be attracted to the north pole, and conversely if the polarity is opposite (S pole), it will move away. The "Level circle" will be displayed in the direction of the geomagnetism (north pole) (north direction) unless there is a metal or magnetic field in the vicinity.
You can also tap the Angle button to display the angle of the magnetic field.
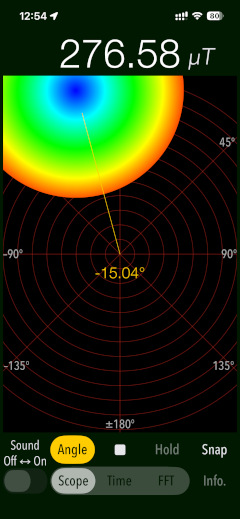
By tapping the center of Scope screen to display it, and tap it again to turn off the display.
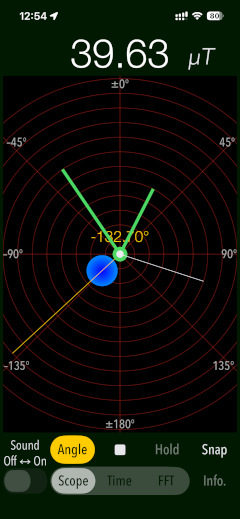
Time transition graph (Time)
Time transition of the RAW data from the magnetic sensor and the post-correction data in the sensor is displayed. It is a time graph of each axis value (Bx/By/Bz) and composite magnetic flux density (Bcomp) in three dimensional space. The vertical axis shows the intensity and the horizontal axis updates with time in real time. You can scroll up to 180 seconds.
- Time Graph
- Upper Graph : Raw magnetic-field (uT) - RAW data by magnetic sensor
- Lower Graph : Calibrated magnetic-field (uT) - post-correction data in the sensor

Frequency analysis (FFT)
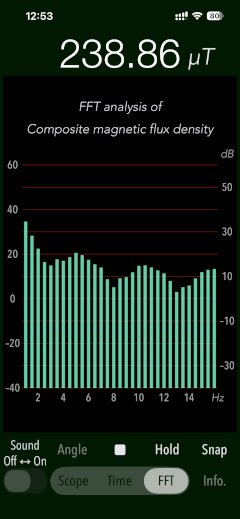
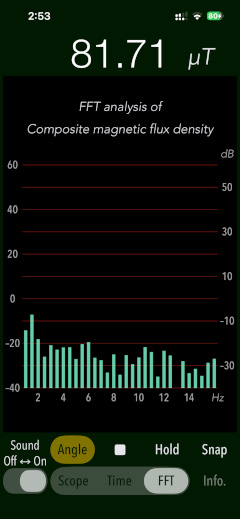
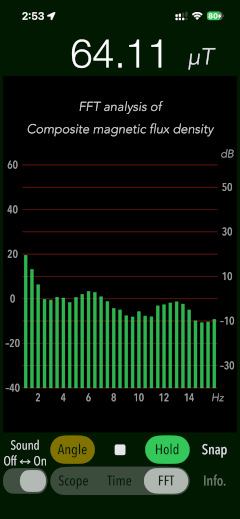
It performs frequency analysis by the FFT for varying AC magnetic field. The FFT analysis result of the composite magnetic flux density is displayed in the graph. By tapping the Hold button during the FFT mode measurement, the peak level of the FFT graph is held and displayed. The maximum value of each frequency component can be observed.
The signal intensity of each frequency component is calculated based on the geomagnetic total intensity. For geomagnetic correction, please set the geomagnetic total intensity of your location within the range of 45±15 (uT). You can set this geomagnetic total intensity on the Info view.

- FFT Graph
- Horizontal axis: Frequency 1 - 16 Hz (0.5 Hz)
- Vertical axis: dB value (Ratio to the default value of 45 μT. The reference value can be set in units of 45 ± 15 μT / 1 μT)
- Reference: To find out the geomagnetic total intensity in your area, the following site will be helpful.
National Oceanic and Atmospheric Administration (NOAA) / Magnetic Field Calculators
Snap Shot
Tap the Snap button to save the current measurement display to Photos. The first time you save, the iOS system will ask for permission to access Photos. Please be sure to allow this access.
Information view
Tapping the Info button will display the product information link and feature description. Tap the Close button again to return to the previous measurement view.

Release Note
- "Magnetscape version 8.0" was released on December 1, 2025. UTC
- "Magnetscape version 7.0" was released on November 15, 2024. UTC
- "Magnetscape version 6.0" was released on January 17, 2024. UTC
- "Magnetscape version 5.0" was released on December 28, 2022. UTC
- "Magnetscape version 4.0" was released on January 22, 2022. UTC
- "Magnetscape version 3.2" was released on February 12, 2021. UTC
- "Magnetscape version 3.1" was released on November 4, 2020. UTC
- "Magnetscape version 3.0" was released on June 3, 2020. UTC
- "Magnetscape version 2.0" was released on June 7, 2019. UTC
- "Magnetscape version 1.1" was released on March 6, 2018. UTC
- "Magnetscape version 1.0" was released on April 19, 2017. UTC
Note
- The display value of this application is the RAW output data from the magnetic sensor itself. It does not make any processing such as filtering processing inside the application.
- Since the magnetic sensor is a sensitive device, the internal reference of the magnetic sensor may be disturbed by prolonged exposure to extremely strong magnets and magnetic fields.
- If the magnetic sensor's reference value is incorrect, the magnetic sensor will automatically readjust after you stop the application and let it sit for a while. If the magnetic sensor is still unstable, try the electronic compass calibration and reset procedure.
- Depending on the terminal model, it may take several seconds to 10 seconds for the magnetic sensor readings to stabilize.
Request for review
Please send us a review of your comments and requests for this app. We will use your feedback to improve our products. Thank you for your cooperation.
- Please access and review from your iOS device.
Contact us
For inquiries and assistance regarding our iOS app products, please contact the following support desk.
About Inquiries
 toon,llc.
 Return to Top