Description
High-Frequency Noise Monitor
![]()
"High-Frequency Noise Monitor" is a high frequency noise analysis tool that specializes in high frequency bands above 8 kHz.
You may be exposed to artificial high frequency noise on a daily basis that is inaudible to the human ear. This app allows you to monitor such high frequency noises and examine their occurrence.
In general, noise may contain relatively high frequency components depending on its source, and this is classified as high frequency noise.
For example, harmonic noise is radiated from the main body of an electronic device or the power lines of a power conversion device such as a AC-DC power adapter, and depending on its power level, it may affect peripheral devices.
There are also devices that generate high frequency noise to drive away vermin such as rats and weasels. The frequency of the sound varies depending on the type of vermin, and some devices incorporate sensors to change the volume and frequency over time. When such devices are installed in the vicinity, there are cases where they can lead to noise problems with adverse effects on human health.
The high frequency noise does not often occur at a constant volume or frequency, but often occurs in a certain cycle or randomly. It is not easy to detect such high frequency noise.
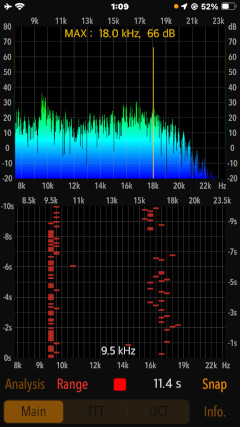
In addition, it retains the PCM data for 20 seconds just before the measurement is stopped, and displays a spectrogram of FFT and octave band analysis. The spectrogram is a graph showing the analysis results of the frequency spectrum of sound with time on the vertical axis, frequency on the horizontal axis, and signal strength in colors, allowing visual observation of the occurrence of high frequency noise.
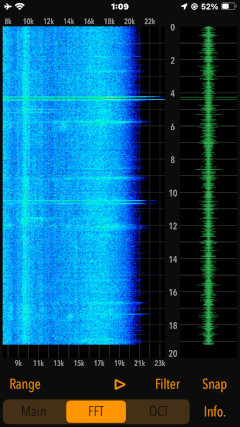
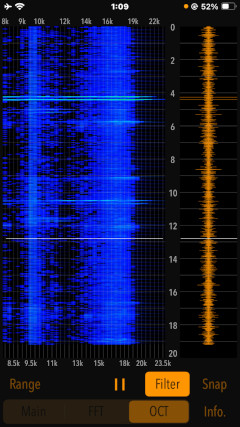
Please click on the link below to access "High-Frequency Noise Monitor" product page in AppStoreTM.
- Communications charges when connecting to AppStore will be borne by the customer.
- iPhone is a trademark of Apple Inc., registered in the U.S. and other countries. AppStore is a service mark of Apple Inc.
Products Information
- Version: 5.0.1
- Release date: December 22, 2025 UTC
- Size: 0.6 MB
- Category: Utilities, Life Style
- Compatibility: Compatible with iPhone. Requires iOS 18.7 or later. iPad products are not recommended.
- Status: Now distributing.
Features
"High-Frequency Noise Monitor" has the following features:
- It collects high frequency noise from the built-in microphone and performs frequency analysis in real time. It can measure up to about 180 seconds, and displays a frequency analysis graph and a time trace (time variation graph). (Main mode)
- FFT and octave band spectrogram analysis is available. The PCM data for 20 seconds immediately before the measurement is stopped is temporarily saved for detailed analysis. (Analysis mode)
- The spectrogram analysis results can be contrasted with the time axis waveform for sound playback.
Specification
- Main: Real-time frequency analysis function.
- Real-time measurement: Automatically stops after a maximum of approximately 180 seconds.
- Maximum frequency detection and power level display (dB unit in 20 μPa standard)
- Time trace display: approx. 10 seconds
- Display gain adjustment (Range): 3 levels (0dB - 90dB / -10dB - 80dB / -20dB - 70dB)
- Analysis: FFT/octave band spectrogram analysis function (PCM data for 20 seconds immediately before the measurement is stopped is saved, and spectrogram analysis is performed.)
- FFT spectrogram analysis (FFT)
- Octave spectrogram analysis (OCT)
- Display gain switching (Range): 3 levels
- Playback function: approx. 20 seconds.
- Playback sound filter (Filter): 8kHz high-pass filter to cut off low-mid range sound.
- Snapshot (Snap): Save the analysis result as an image file.
Applications
- Visualization and analysis of high frequency noise generated by vermin repellent devices, mechanical devices, electronic devices, etc.
- Observation of sudden or time-varying high frequency noise.
- Detection of mosquito noise
Spectrogram
The spectrogram is a graphical image with two geometric dimensions that the horizontal axis represents time and the vertical axis is frequency, and the addtional third dimension is indicating the amplitude of a particular frequency at a particular time that is represented by colour of each point in the image.
- Measurement display X-axis - time(sec)
- Measurement display Y-axis - frequency(Hz)
- Measurement display color image - signal's amplitude
Important initial settings (iOS permissions)
In order for this app to work properly, it is necessary to make the following initial settings related to the iOS system.
- Microphone access permission setting
- Photos access permission setting
At the initial startup after installing the app, the iOS system asks for permission to access the built-in microphone. In this case, you need to enable access to "Microphone".
If you have not enabled this setting, this app can not work by privacy restrictions of the iOS system. Please enable the access permission on the iOS setting, "Settings > Privacy & Security > Microphone".
When the first time you save an image data with Snapshot, the iOS system asks for permission to access the "Photos" library. In this case, you need to enable access to "Photos".
If you have not enabled this setting, this app can not work by privacy restrictions of the iOS system. Please enable the access permission on the iOS setting, "Settings > Privacy & Security > Photos".
Basic Operations
This application performs real-time frequency analysis (FFT, time trace) of the audio signal collected using the built-in microphone, and displays a spectrogram (FFT, octave band analysis) of a specific time.
# Initial startup screen on MAIN view
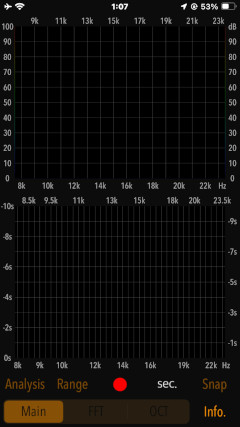
Note that the INFO view will be displayed when the app is launched for the first time, and you will see a description of the functions.
The basic operation of this app is as follows.
1) Real-time frequency analysis
In Main mode, tap the Start button to perform real-time frequency analysis of the PCM data collected from the built-in microphone, and display the FFT graph and time trace.
2) Perform spectrogram analysis
When you tap the Analysis button after the measurement, the spectrogram analysis process using FFT and octave band analysis will be executed. The PCM data for 20 seconds just before the measurement is stopped in Main mode is temporarily saved, and the spectrogram analysis is performed on the PCM data.
3) Data storage of analysis results
By tapping the SNAP button, you can save the analysis results of Main and Analysis modes as image data.
Functions
- Main mode: Real-time frequency analysis
Tap the Start button to start the measurement operation. Real-time frequency analysis is performed on the PCM data collected from the built-in microphone, and the FFT graph and time trace are displayed. Measurement stops automatically after a maximum of about 180 seconds, and can be stopped at any point by tapping the Stop button.
On the FFT graph, the frequency at which the maximum level was detected during the measurement is displayed, and the frequency and power level (dB) are displayed numerically in orange.
The Range setting allows you to change the display range to make the graph easier to see.
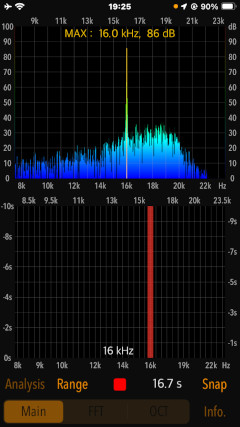
- Analysis mode: Spectrogram analysis
Tap the Analysis button to perform a spectrogram analysis.
Tap FFT or OCT buttons, you can view the analysis results. In the display of each analysis result, by tapping the Play button, the sound waveform and the spectrogram analysis result will be simultaneously traced and displayed while playing the sound data. The current playback position is displayed as a cursor.
The Range setting allows you to change the display range to make the graph easier to see.
When Filter is enabled during sound playback, it can cut off mid and low frequency sounds below 8 kHz.
Spectrogram by FFT (FFT)Displays the spectrogram by FFT. By tapping the Play button, you can check the analysis result while playing the sound.
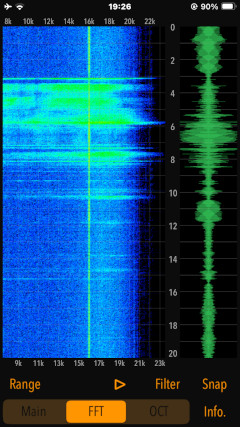
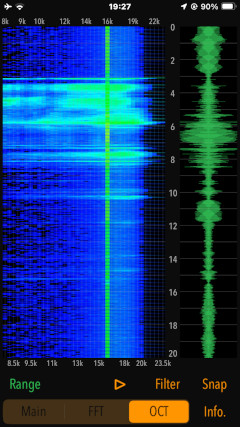
Spectrogram by Octave Band Analysis (OCT)This function displays a spectrogram by octave band analysis, which is a frequency division based on the frequency component analysis data obtained by FFT. Compared to FFT, the frequency bands are grouped together to make a compact spectrogram that is easier to grasp. By tapping the Play button, you can check the analysis result while playing the sound.
Snapshot
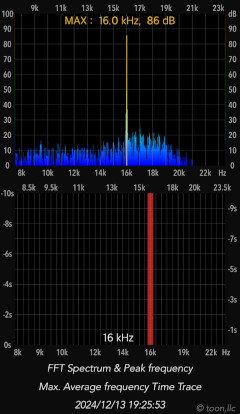
Snapshot is a function that captures and saves the app display as a still image.
Tap Snap button, the display image will be saved as a PNG file in PNG format. A time stamp will also be added to the image. The file name will be IMG_xxxx.png.
Once you save at the first time, you will be asked by iOS system to confirm the permission to access the camera roll. Please refer to the Important initial settings section.
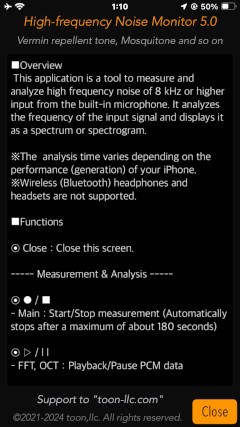
Information view
By tapping INFO button, it is displayed the product information and usages. This view will also be displayed when the app is first launched after installation. To return to the previous screen by tapping Close button.
Release Note
- Version 5.0.1 was released on December 22, 2025. UTC
- Version 5.0 was released on December 15, 2024. UTC
- Version 4.0 was released on October 11, 2023. UTC
- Version 3.0 was released on February 1, 2023. UTC
- Version 2.0 was released on June 18, 2022. UTC
- Version 1.0 was released on October 7, 2021. UTC
Note
- The authorization for access to the built-in microphone will be confirmed by the iOS system at first boot. Please enable access to the microphone. Be sure to configure the iOS settings. If not, this app will not work properly. Please refer to the Important initial settings section.
- The analysis time varies greatly depending on the performance (generation) of your iPhone.
- Wireless (Bluetooth) headphones and headsets are not supported.
Request for review
Please send a review of your comments and requests for this app. We will use your review to improve our products. Thank you for your cooperation.
- Please fill in your review by accessing from iOS device.
Contact us
For inquiries and consultation regarding our iOS app products, please contact the following support desk.
About Inquiries
Support index

 Return to Top