Description
Hearing Analyzer Portrait
![]()
"Hearing Analyzer Portrait" is a hearing health check tool that allows you to measure your hearing over a very wide range of audible frequencies.
The human ear possesses an auditory range that up to 20000Hz. In addition to conventional audiometry (125 - 8000Hz), the extended low-frequency audiometry and high-frequency audiometry including Mosquito sounds are available. You can self-diagnose the sound listening ability.
By measuring the characteristics of your current hearing, please try to consider the wellness of your ears and the way of natural sound reproduction. It is possible to measure the hearing of the audio range by finding the minimum point in the operation of the slider volume that you can hear the testing pure tone for each frequency. The results are displayed in easy-to-read charts like the audiogram.
Recommended to check your own hearing ability on a daily basis for the audiophile, music players, sound professionals and all music lovers. Try to check if you have the golden ears!
In general, a high risk of hearing loss has been known if you continue to hear the sounds of a high acoustic pressure level, such as, listening of the portable audio and working with too loud noises. According to WHO, some 1.1 billion teenagers and young adults are at risk of hearing loss due to the unsafe use of personal audio devices, including smartphones, and exposure to damaging levels of sound at noisy entertainment venues such as nightclubs, bars and sporting events.
Please click on the link below to access "Hearing Analyzer Portrait" product page in AppStoreTM.
![]()
- Communications charges when connecting to AppStore will be borne by the customer.
- iPhone is a trademark of Apple Inc. registered in the U.S. and other countries. AppStore is a service mark of Apple Inc.
Products Information
- Version: 6.0.3
- Release date: January 1, 2026 UTC
- Size: 0.6 MB
- Category: Utilities, Life style
- Compatibility: Compatible with iPhone. Requires iOS 18.7 or later.
- Status: Now distributing.
Features
- Reduced measurement time for simple user interface.
- Wideband hearing check.
- Optimized for iPhone, Very compact code size.
- Hearing test in 3 frequency bands:
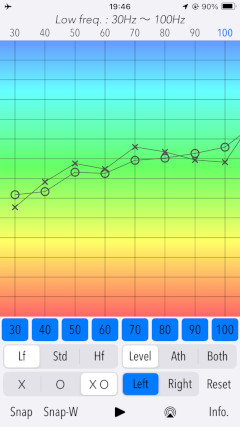
- Lf (Low Frequency) - 30Hz to 100Hz
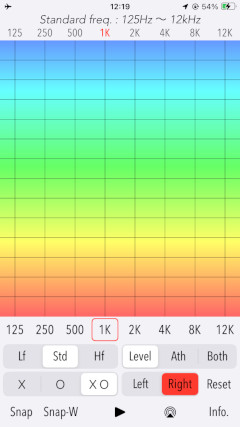
- Std (Standard frequency) - 125Hz to 12kHz
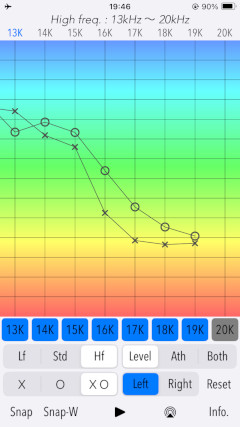
- Hf (Mosquito, Extended High Frequency) - 13kHz to 20kHz - Test tones : Pure tone
- Lf: 30, 40, 50, 60, 70, 80, 90, 100 (Hz)
- Std: 125, 250, 500, 1k, 2k, 4k, 8k, 12k (Hz)
- Hf: 13k, 14k, 15k,16k, 17k, 18k, 19k, 20k (Hz) - Test tone type: Intermittent signal (Tone A) / Continuous signal (Tone B)
- Test channel: Left / Right
- Measurement result graph display:
- Ath: ATH compensation [*1]
- Level: Linear level without ATH compensation - Clear setting and result graph. (Reset)
- Snapshot of single range result graph (Snap)
- Snapshot of full range result graph (Snap-W)
Applications
- Simple testing of the hearing loss.
- Confirmation of the listening skills of the audio band.
- Self check the limit of audible frequency.
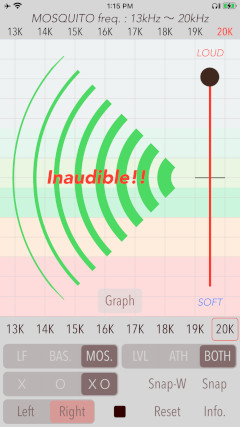
Top View
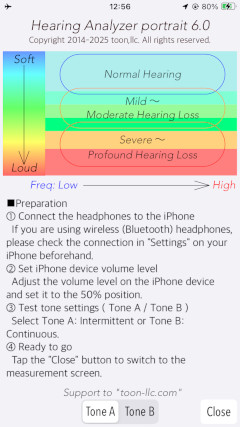
At the first boot, the info view will be displayed. Please make sure you read the description and attentions. If you tap Close button, the top view will be displayed.
# Info view, Top view
Operation procedures
Operation procedures in this application are as follows, please use this app carefully according to the guidelines.
- Step 1: Connect headphones to your iPhone.
- Step 2: Set iPhone's volume to 50% by using the external button.
- Step 3: Select the type of test tone (Intermittent Tone: Tone-A or Continuous Tone: Tone-B) in the Info view. The default is the intermittent tone.
- Step 4: Tap Close button of the Info view.
- Step 5: Set the headphone to your ears.
Preparation
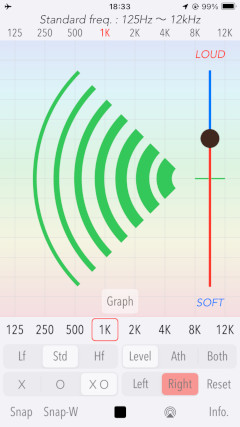
- Op-1: Tap Right or Left button to select hearing test channel.
- Op-2: Select the frequency band (Lf, Std, Hf) and a frequency to test. ie."Std" and "1k".
・Lf: Low frequency band (30 - 100Hz)
・Std: Standard Frequency band (125Hz - 12kHz)
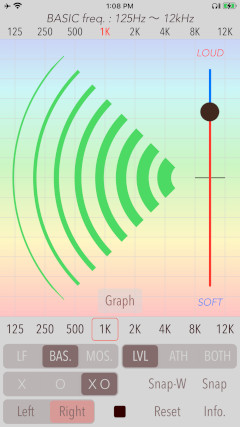
・Hf:High Frequency band (13kHz - 20kHz) - Op-3: Tap START button. It starts to be output the test tone, periodic sound of pure tone.
- Op-4: Adjust the software volume to find the minimum sound point at the limit of audibility. Be careful so as not to be loud and move slowly as possible.
- Op-5: Once the minimum point of hearing is determined, tap Stop button.
- Op-6: Subsequently, if you want to measure the frequency of the other, please repeat from the operation of Op-1.
- Op-7: Please tap Graph button after these measurements were completed. Result of the measurement graph is displayed.
- Op-8: By tapping Snap/Snap-W button, the measurement result graph can be saved as image data to "Photos".
- Op-9: By tapping Reset button, you can reset the measurement result graph and each settings.
Procedures of Hearing Test
# Attention
- This app generates a test tone signal with a high gain, so please special attention to the volume adjustment.
- Before the diagnosis start, please set the hardware volume control to the central position of 50%.
- Carefully adjust the playback volume so as not to be excessively large gain for your ears.
Inaudilbe Display
At the maximum gain of volume control, "Inaduible!" is displayed on the screen, and the measurement result is not reflected even if you tap Stop button. This state shows the hearing measurement limit level. The frequency button turns Gray color and a warning is displayed.
Testing Result Graph
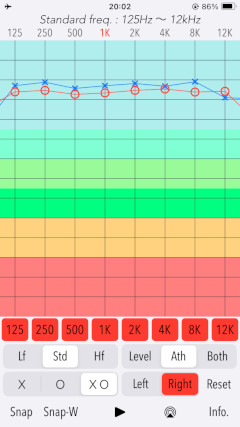
This app will display a graph result of the measurement of the minimum sound in each frequency that you could take to hear. The measurement result graph has two display formats: Level graph (broadband frequency characteristic display, no ATH correction), and Ath graph (frequency characteristic with ATH correction).
You can switch the graph display by Level/Ath/Both button.
In addition, you can switch channels in the graph display with x (Left), o (Right), and xo (Left and Right) buttons.
Please use them to compare measurement results as necessary.
- Level graph
This graph is a graphical representation for wideband frequency measurement.
It shows a linear frequency characteristic without ATH compensation. It covers the frequency range from 30Hz to 20kHz. Since the sensitivity of human hearing is different depending on the frequency band and will be a trapezoid graph in general.
Please use it if you're looking at a difference in each frequency.
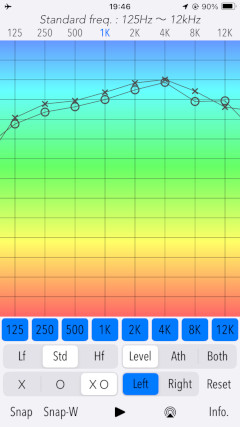
- Ath graph
This is a graphical representation applied compensation of the frequency characteristics to fit the lowest audible value of human beings. If it is a higher level and flat as possible, the graph is estimated to be good condition of your hearing.
This graph has the same characteristic display as Audiogram of the general hearing test.
In addition, the Absolute Threshold of Hearing (ATH) is the minimum sound pressure level that can be detected by hearing noise-free environment. It has been corrected to be a flatter graphical representation for each frequency in the case of normal hearing. However, it may display levels vary significantly, due to the surrounding environment and individual differences.
In the Lf and Hf frequency bands, the information in the Ath graph is for reference only.
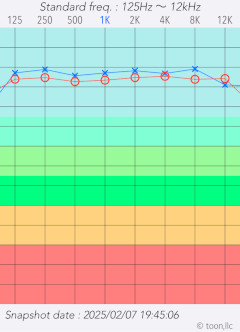
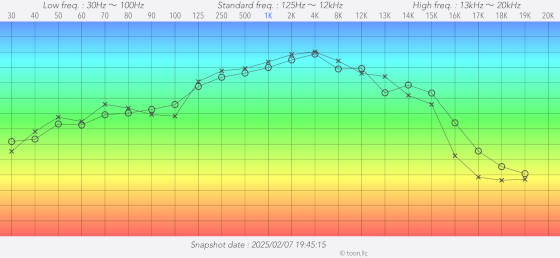
Snapshot
By tapping Snap or Snap-W button, the measurement result graph can be saved as an image data to "Photos". Snap stores the measurement result graph for the currently displayed single frequency band, while Snap-W stores the measurement result graph for the entire frequency band. Since it can save with time stamp, please use it when you want to save your measurement result.
# Image sample of Snap
# Image sample of Snap-W
Information view
Tap Info button on the top view to display the Info view. Please check the product information and instruction manual. Test tone selection (Tone-A/Tone-B) can also be performed in this view. To return to the top view, tap Close button.
Release Note
- Version 6.0.3 was released on January 1, 2026.
- Version 6.0 was released on February 7, 2025.
- Version 5.0 was released on March 9, 2023.
- Version 4.0 was released on July 14, 2022.
- Version 3.3 was released on March 3, 2021.
- Version 3.2 was released on February 24, 2021.
- Version 3.1 was released on November 18, 2020.
- Version 3.0 was released on March 28, 2020.
- Version 2.1 was released on August 6, 2019.
- Version 2.0 was released on May 30, 2018.
- Version 1.2 was released on March 2, 2016.
- Version 1.1 was released on April 22, 2015.
- Version 1.0 was released on October 7, 2014.
Remarks
- We hope that you keep to have an interest on a daily basis to the wellness of hearing by this app. If you feel the need to health management of ear, it is recommended to visit the medical specialist.
- Please be careful that high-volume sounds can damage ears, even if your ears don't perceive them as being too loud. Please have enough attention to adjust the volume of the iPhone. Recommend
- This app does not support all wireless headphones and only supports Bluetooth (A2DP) headphones. If you cannot confirm the connection, use wired headphones.
- This app does not support wireless control of volume/channel balance unique to wireless audio devices such as AirPods.
- The classification of the hearing ability refers to WHO.
- World Health Organization (WHO) statement on the risk of hearing loss.
- Deafness and hearing loss
- New WHO-ITU standard aims to prevent hearing loss among 1.1 billion young people
- Video gamers worldwide may be risking irreversible hearing loss and/or tinnitus
Disclaimer
This app is not intended to be used for a medical purpose. This app is not intended to diagnose, prevent, monitor, treat, alleviate or compensate a disease, an injury, a disability or a handicap. If you think you have hearing problems, please consult with your doctor, or other qualified healthcare professional. Please use this app at your own risk. TOON,LLC don't take any responsibility for direct or indirect damage that could result from its use.
Request for review
Please send a review of your comments and requests for this app. We will use your review to improve our products. Thank you for your cooperation.
- Please fill in your review by accessing from iOS device.
Contact us
For inquiries and consultation regarding our iOS app products, please contact the following support desk.
About Inquiries
Support index