Description
Sound Level Analyzer PRO
![]()
"Sound Level Analyzer PRO" is an integrated sound measurement app featuring a sound level meter and powerful acoustic analysis tools. It is a professional-grade sound level measurement app further evolved from "Sound Level Analyzer".
It is available for a wide variety of applications, such as measuring ambient noise in neighborhoods, testing audio systems, checking interior noise in vehicles, checking sound at live events, and much more.
Its advanced sound analysis capabilities allow you to perform real-time frequency spectrum analysis, time-varying level measurement, and in-depth statistical analysis of sound levels.
It can also be used to analyze the multifaceted characteristics and trends in the occurrence frequency of any sound source.
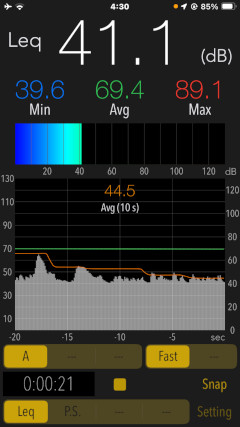
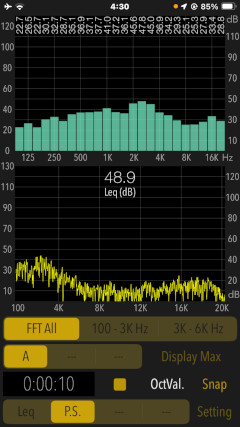
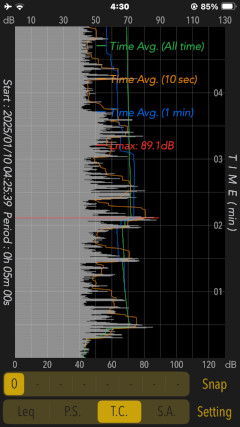
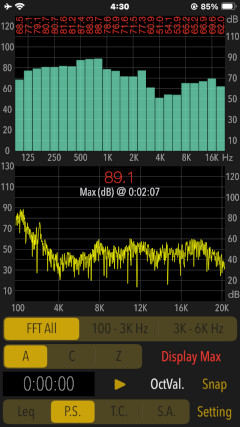
The WHO has proven direct links between noise and health risks; tinnitus, sleep disturbance, stress, cognitive impairment, heart diseases and annoyance in general. Please check your environmental noise for your wellness.
Please click on the link below to access "Sound Level Analyzer PRO" product page in AppStoreTM.
- Communications charges when connecting to AppStore will be borne by the customer.
- iPhone is a trademark of Apple Inc., registered in the U.S. and other countries. AppStore is a service mark of Apple Inc.
Products Information
- Version: 8.0
- Release date: January 19, 2026. UTC
- Size: 0.8 MB
- Category: Utilities, Life style
- Compatibility: Compatible with iPhone. Requires iOS 26.2 or later.
- Status: Now distributing.
Features
"Sound Level Analyzer PRO" has the following features:
- Sound level measurement (dB): Main (Leq)
- Leq (equivalent sound level), Min (minimum value), Max (maximum value), Avg (time average equivalent sound level)
- Frequency weighting correction characteristics:
A (general sound level measurement with auditory correction)
C (sound level measurement with almost flatter correction than A correction, e.g. peak evaluation at high volume)
Z (flat characteristics without auditory correction, physical sound level measurement)- Time weighting characteristics: Fast = 0.125 sec, Slow = 1.0 sec
- Display Range: 0 - 130 dB
- Power Spectrum (P.S) : View of frequency spectrum analysis
- Spectrum analyzer function: FFT analysis, 1/3-octave band response analysis.
- 1/3-octave band center frequency: 25, 31.5, 40, 50, 63, 80, 100, 125, 160, 200,
250, 315, 400, 500, 630, 800, 1k, 1.25k, 1.6k, 2k, 2.5k, 3.15k, 4k, 5k, 6.3k, 8k, 10k, 12.5k, 16k, 20k (Hz)- FFT frequency range settings: 100Hz - 20kHz (FFT all) / 100Hz - 3kHz / 3k - 6kHz
- Measured value display function in 1/3 oct band response analysis. (OctVal)
- Power spectrum display function at the time of occurrence of Max. (Display Max)
- Time Course (T.C): View of time-history of the sound level.(graphical representation after measuring completion.)
- Time-domain fluctuation level display function: up to 8 hours linked on a timer.)
- Statistical Analysis (S.A) : Statistical analysis of sound level at A-weighting and Fast. (analysis display after measuring completion.)
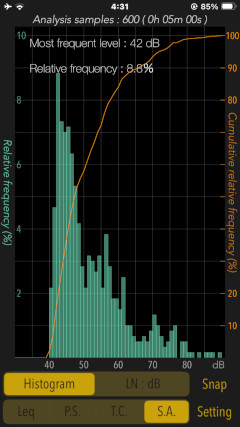
- Histogram: Displays all detected sound level distribution as a percentage.
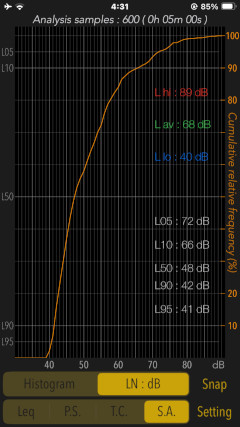
- Percentile level (LN:dB): Display the levels of L05 / L10 / L50 / L90 / L95 on the percentile level graph.
- Calibration function: level correction value settings, -20 to +20dB / 0.1dB unit
- Measurement timer function (Timer): 1 minute / 5 minutes / 10 minutes / 15 minutes / 20 minutes / 30 minutes / 1 - 8 hours (1 hour unit)
- Snapshot (Snap): Save measurement display with time stamp to Photos.
Applications
"Sound Level Analyzer PRO" can be used for various applications as follows:
- Applications
- Live Sound
- Environmental noise measurement
- Setting and Tuning of Audio system
- Installation of Audio equipments
- Installation of Car audio equipments
- Architectural acoustics
- Device management
- Example of usage scenarios
- To measure the quiet characteristics (low noise level) of home appliances.
- To measure the noise level of a household electrical appliance.
- To know the noise level of your own car, or to compare the noise level of a new car during a test drive as a consideration for purchase.
- To know the noise level of your own home or the noise level of the surrounding environment.
- To measure the noise level in the workplace.
- To check the sound level or background noise level when playing music.
Noise exposure risks
The followings are examples of sound sources and noise levels.
- Examples of sound sources and noise levels
130 dB: Engine sound of Airplane
110 dB: Horn of Car
100 dB: Noise of passing train
90 dB: In loud factory
80 dB: In the train, Vacuum cleaner
70 dB: Noisy office, Noisy street
60 dB: Quiet Car, Normal conversation
50 dB: Quiet office
40 dB: In the library, Quiet residential area
30 dB: Outskirts of midnight, Whisper
20 dB: Sounds of rubbing leavesNote: The standard noise measurement range is 30-130 dBA, and the measured value (Leq) is about 30 dBA in a quiet room of the household. Due to the presence of background noise, noise levels are never measured at 0dBA even in very quiet environments. In a typical anechoic room, the noise level is around 5-15 dBA.
The World Health Organization (WHO) has published noise level indicators related to health risks caused by noise, which are listed below as a reference for noise management.
In general, the quality of life begins to be affected at levels above 60 dB, and the risk of health problems increases at levels above 80 dB. Prolonged exposure to high levels of noise can cause temporary hearing loss, as indicated below.
- Noise level and permissible exposure time
100dB: only a few minutes/day (weekly limit of 20 minutes)
95 dB: 10 minutes/day (weekly limit 1 hour 15 minutes)
90 dB: 30 minutes/day (weekly limit 4 hours)
85 dB: 1 hour 45 minutes/day (weekly limit 12.5 hours)
80 dB: 5.5 hours/day (weekly limit 40 hours)
Important initial settings (iOS permissions)
In order for this app to work properly, it is necessary to make the following initial settings related to the iOS system.
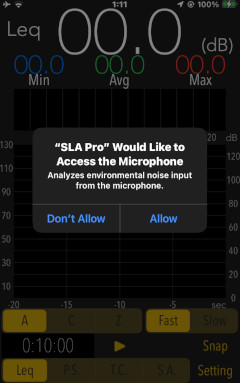
- Microphone access permission setting
At the initial startup after installing the app, the iOS system asks for permission to access the built-in microphone. In this case, you need to enable access to "Microphone".
If you have not enabled this setting, this app can not work by privacy restrictions of the iOS system. Please enable the access permission on the iOS setting, "Settings > Privacy & Security > Microphone".
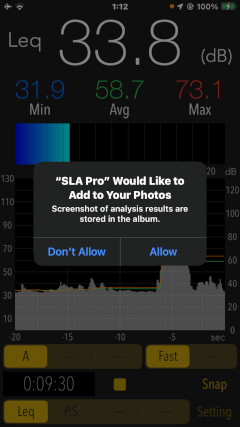
- Photos access permission setting
When the first time you save an image data with Snapshot, the iOS system asks for permission to access the "Photos" library. In this case, you need to enable access to "Photos".
If you have not enabled this setting, this app can not work by privacy restrictions of the iOS system. Please enable the access permission on the iOS setting, "Settings > Privacy & Security > Photos".
Operation Mode
"Sound Level Analyzer PRO" has four types of measurement analysis modes. By tapping on each mode button, you can select one of the modes and display it. The function of each mode is as follows.
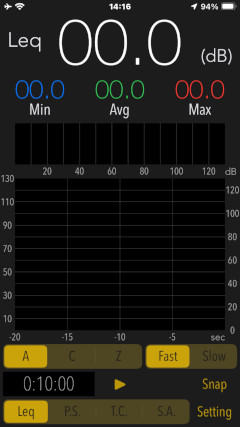
- MAIN (Leq): Sound level measurement (dB)
- P.S: Power Spectrum
- T.C: Time Course (graphical representation after measuring completion.)
- S.A: Statistical Analysis (analysis display after measuring completion.)
Measurement analysis modes
"MAIN (Leq) mode" and "P.S mode" are also switched during measurement operation.
"T.C mode" and "S.A mode" can be selected and displayed only after the sound level measurement is completed.
In addition, it will start up in MAIN (Leq) mode at the first boot-up.
MAIN (Leq): Sound Level Measurement
"MAIN (Leq) mode" makes the sound level measurement in general. In this case, by applying the appropriate Frequency Correction, Time Correction, and Level Correction, you can be the best sound level measurement.
Tap the play button to start the sound level measurement, and it then pause by tapping it again.
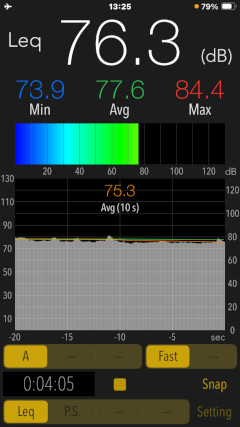
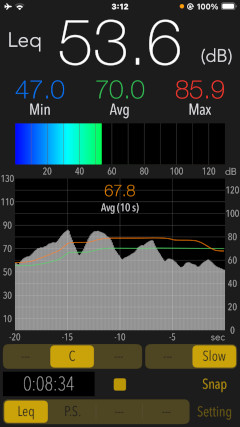
- Leq: Equivalent sound level - Instantaneous value of sound level (Noise level) (dB)
- Avg: Time average equivalent sound level - Time moving average value (dB)
- Min: Minimum sound level - Minimum value within the measurement time (dB)
- Max: Maximum sound level - Maximum value within the measurement time (dB)
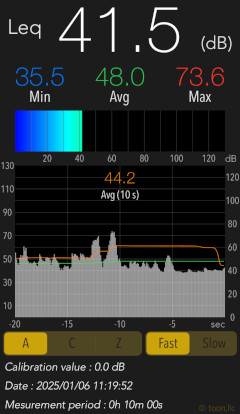
Sound level measurements are displayed measured values of Equivalent continuous sound level (Leq), minimum value (Min), maximum value (Max) and Time average equivalent sound level (Avg) in dB units. The Leq is also displayed as a color bar graph.
It also displays a short-term time variability graph at the same time. This graph shows the sound level fluctuations for the past 20 seconds. The graph shows the Leq level (white bar), the Avg level (green line), and the moving average level for 10 seconds (orange line).
It can be measured as parameters, Time weighting correction, Frequency weighting correction, and Level calibration, to set as follows:
- FAST: 0.125 sec (Default)
- SLOW: 1.0 sec
Time weighting correction
It specifies the time constant of calculating the sound level. Please set in accordance with the occurrence tendency and type of sound source.
- A: A correction - General sound level measurement with auditory correction (Default)
- C: C correction - sound level measurement with almost flatter correction than A correction, e.g. peak evaluation at high volume
- Z: Non correction - flat characteristics without auditory correction, physical sound level measurement
Frequency weighting correction
It is a weighting filter that limits the frequency band of the input signal. Please set according to the measurement applications.
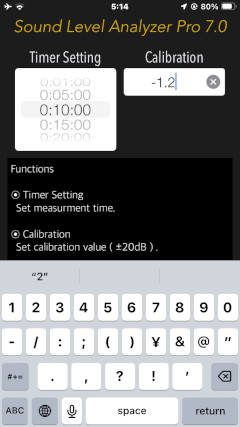
- Offset ranges: -20dB to +20dB in 0.1dB unit
Level Calibration
You can specify the reference level in the offset range. Tap the calibration value window in Info view, the input keyboard will appear. If you have the standard sound level meter, please use it to adjust the reference level.
P.S: Power Spectrum
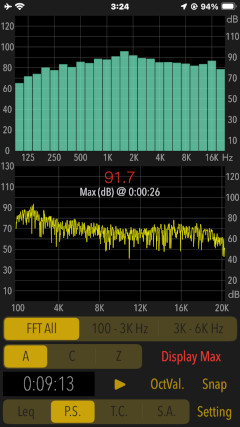
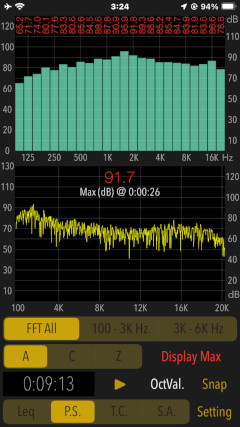
"P.S mode" displays frequency spectrum analysis in real time. Measurement is displayed by 1/3 octave band response and FFT analysis.
The 1/3 octave band analysis displays the signal response of the input signal's frequency spectrum in 1/3 octave and 24 band (100 Hz to 20 kHz).
FFT analysis displays the FFT spectrum by Fast Fourier transform. You can also select the FFT frequency range with high audibility.
- All: 100Hz - 20kHz
- Scope 1: 100Hz - 3kHz
- Scope 2: 3kHz - 6kHz
FFT frequency range
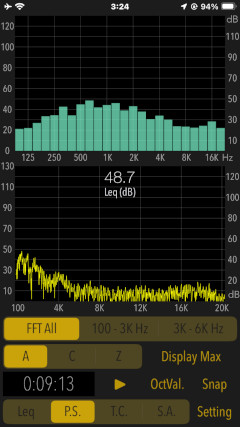
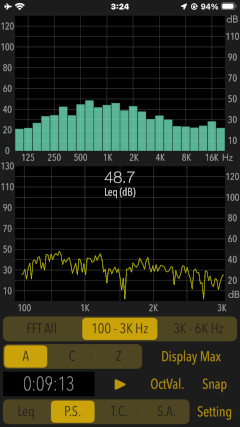
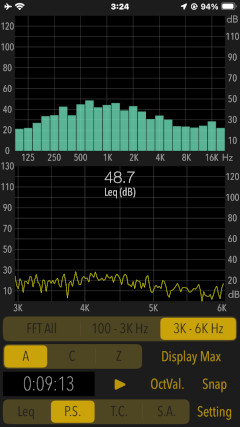
Tap "OctVal" button, it can display the measured values for each band of 1/3 octave band analysis in real-time.
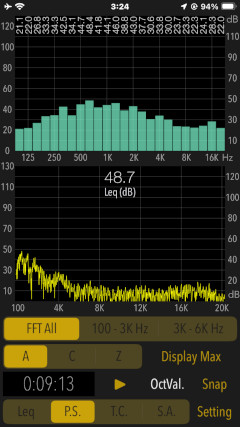
Tap "Display Max" button, it can display the frequency spectrum characteristics at the moment when the maximum sound level "Max" has occurred. At this time, you can see the measured values for each frequency band by tapping "OctVal" button.
T.C: Time Course
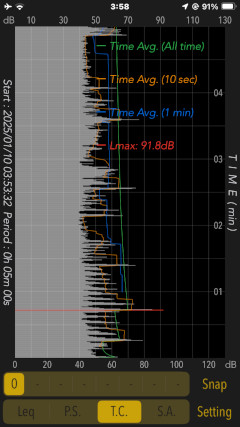
"T.C. mode" displays the time course graph of the sound level.
In conjunction with the timer, fluctuation data of the sound level up to 8 hours is recorded, and the time course graph can be displayed in all the measurement time. "T.C. mode" can be selected only after measuring completion.
The time course graph is displayed with time as Y axis and sound level (dB) as X axis, and it can be displayed by scrolling. The moving average level can also be displayed.
In addition, you can select graph display in 1 hour unit with the buttons from "0" to "7" at the bottom.
S.A: Statistical Analysis
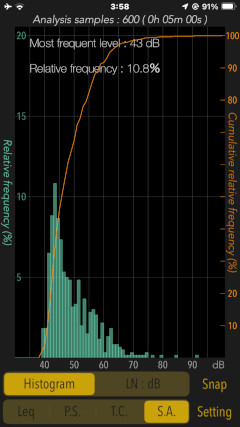
"S.A. mode" displays the statistical analysis focusing on sound level fluctuation.
In conjunction with the timer, fluctuation data of the sound level up to 8 hours is recorded, Histogram and Percentile level can be displayed as a sound level statistical analysis on all measurement time. "S.A. mode" can be selected only after measuring completion.
Histogram
It displays the noise level distribution showing the occurrence frequency of sound level as a percentage. It can intuitively grasp which sound level occurred frequently in all measurement time. It may be shown the occurrence of steady noise and the distribution trend of the noise floor. The X axis is the sound level (dB), and the Y axis is the incidence of each sound level. In addition, the cumulative relative frequency distribution curve is also displayed.
Percentile level
It displays the percentile level LN (L5, L10, L50, L90, L95), and the cumulative relative frequency distribution curve.
In this statistical analysis, when the total time exceeding a certain level corresponds to N% of the measured time in the fluctuating noise within the measured time, the noise level is expressed as N% hourly noise level (LN). The percentile level can be used to evaluate the noise environment where the noise level is random or it fluctuates dramatically.
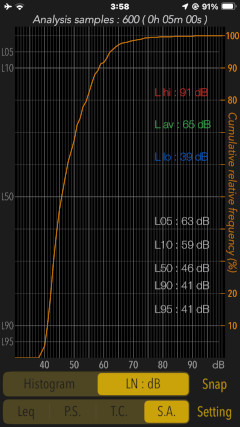
Also, in the sound statistical analysis, the following measurement time is required. Please note that the required measurement time varies depending on the timer setting.
- 1 min: 10 sec or more
- 5 min: 30 sec or more
- 10 min over: 60 sec or more
Timer setting and Required measurement time
Snap Shot
Tap "Snap" button, you can capture the measured image to Photos. It is possible in all modes.
Timer
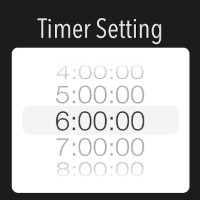
Tap "Setting" button to display the timer settings in the Info view. The setting time can be selected by the picker from 1 minute to a maximum of 8 hours. To return to the previous view by tapping "Close" button.
- Timer period: 1 min / 5 min / 10 min / 15 min / 20 min / 30 min / 1 - 8 hour (1 hour unit)
Information
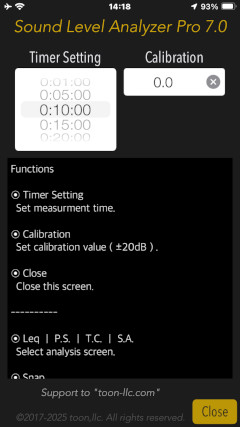
Tap "Setting" button, it is displayed the function description and the measurement settings in Info view. The screen description can be scrolled up and down. To return to the previous view by tapping "Close" button.
Release Note
- Version 8.0 was released on January 19, 2026 UTC.
- Version 7.0 was released on January 10, 2025 UTC.
- Version 6.0.1 was released on October 2, 2023 UTC.
- Version 6.0 was released on September 28, 2023 UTC.
- Version 5.1 was released on October 21, 2022 UTC.
- Version 5.0 was released on September 28, 2022 UTC.
- Version 4.1 was released on October 28, 2021 UTC.
- Version 4.0 was released on October 20, 2021 UTC.
- Version 3.3 was released on February 10, 2021 UTC.
- Version 3.2 was released on November 2, 2020 UTC.
- Version 3.1 was released on May 16, 2020 UTC.
- Version 3.0 was released on May 14, 2020 UTC.
- Version 2.1 was released on March 30, 2019 UTC.
- Version 2.0 was released on November 13, 2018 UTC.
- Version 1.2 was released on May 18, 2018 UTC.
- Version 1.1 was released on March 14, 2018 UTC.
- Version 1.0 was released on December 12, 2017 UTC.
Note
- This app is adjusted the reference value for iPhone. However, the built-in microphone of your iPhone is likely to have a non-uniform gain. The more exact measurement should be calibrated using the absolute level calibration devices.
- The standard noise measurement range is 30-130dBA, and the measured value (Leq) is about 30dBA in a quiet room of the household. Due to the presence of background noise, noise levels are never measured at 0dBA even in very quiet environments.
Request for review
Please send a review of your comments and requests for this app. We will use your review to improve our products. Thank you for your cooperation.
- Please fill in your review by accessing from iOS device.
Contact us
For inquiries and consultation regarding our iOS app products, please contact the following support desk.
About Inquiries
Support index

 Return to Top